
Uptime, MTTR, MTBF and the Nines: Monitoring Terms in Plain English


Uptime is the share of time a service was reachable. MTTR is the average time to fix an outage. MTBF is the average time between two outages. The nines are shorthand for availability tiers: 99.9 percent is three nines. It reads dry, but it decides what goes into your client contract, and whether you can prove it at month-end.
This post explains the terms that show up on every status page, in every SLA and in every monitoring dashboard. Each section also tells you what the term means for your client contract. Because a number you cannot turn into a promise does little for you in a client conversation.
Uptime: the percentage you promise
Uptime is the share of time a service was reachable and working, measured over a period and shown as a percentage. 100 percent would mean it never went down. 99.9 percent means it was unreachable 0.1 percent of the time.
The value comes from the ratio of successful checks to all checks. If a monitor probes your client site every 30 seconds and it was reachable in 99.95 percent of those checks, uptime for the period sits at 99.95 percent. What matters is where the checks come from: a single probe location can mistake a local network fault for a real outage. When checks run from several European locations and an outage only counts once confirmed, the number measures real reachability instead of noise.
What this means for your client contract: Uptime is the number you promise. Write "99.9 percent availability" into the contract and it becomes a verifiable commitment, not a slogan. At month-end you have to back it up, otherwise the promise is worthless or even a liability. For how to measure and set up those percentages cleanly, see the uptime monitoring page.
Downtime and the error budget
Downtime is the flip side of uptime: the time a service was unreachable. At 99.9 percent uptime, 0.1 percent downtime is left over. That remaining slice is your error budget, the outage duration you can afford without breaking the promise.
In concrete numbers it gets easier to grasp:
| Uptime | Downtime per month (30 days) | Downtime per year |
|---|---|---|
| 99 percent | about 7.2 hours | about 3.65 days |
| 99.9 percent | about 43 minutes | about 8.8 hours |
| 99.95 percent | about 21 minutes | about 4.4 hours |
| 99.99 percent | about 4.3 minutes | about 52.6 minutes |
What this means for your client contract: The error budget turns an abstract percentage into something you can plan around. Once you know that 99.9 percent allows only about 43 minutes per month, you schedule maintenance windows and deployments inside that budget on purpose, instead of burning it unnoticed on a bad day. Planned maintenance can be excluded from downtime cleanly through a maintenance window, so it does not weigh on your SLA number for no reason.
The nines: 99, 99.9 and 99.99 percent
"The nines" is industry shorthand for uptime tiers, counted by how many nines appear in the percentage. Two nines is 99 percent, three nines is 99.9 percent, four nines is 99.99 percent, five nines is 99.999 percent. When someone says "we run three nines," they mean 99.9 percent uptime.
Here is the key point: each extra nine cuts the allowed outage budget by a factor of ten. Moving from 99.9 to 99.99 percent looks tiny on paper, but it shrinks the monthly outage budget from about 43 minutes to about 4. And every added nine costs disproportionately more: better redundancy, faster response, more effort.
What this means for your client contract: Only promise the nines you can actually hold. One nine too many looks great in the sales pitch and becomes a trap at month-end, when a single longer outage blows the budget. Realistic three nines, cleanly proven, are worth more than four nines you miss. Five nines (about 26 seconds per month) are neither necessary nor economically sustainable for most agency clients.
MTTR: how fast you get back up
MTTR stands for Mean Time To Recovery (or Repair), the average time it takes to fix an outage. It is measured from the start of the incident to restoration, averaged across many incidents. If a site goes down three times and recovery takes 10, 20 and 30 minutes, MTTR sits at 20 minutes.
MTTR is the recovery-speed metric. It hangs less on technology than on process: how fast the right team member learns about the outage, how fast they respond, how fast the cause is fixed. An alert that instantly reaches the right person and escalates to the next tier when unacknowledged pushes MTTR down noticeably. An alert lost in the noise drives it up.
What this means for your client contract: Many SLAs carry an MTTR promise, such as "resolution within 30 minutes." It caps how long the client sits with a broken site, and it often matters more than the raw uptime figure, because it describes the experience in a real incident. To hold an MTTR promise, you need reliable alerting with multi-tier escalation. That is exactly what smart alerting is for, passing an unacknowledged alert to the next person automatically.
MTBF: how reliably it runs between outages
MTBF stands for Mean Time Between Failures, the average operating time between two consecutive outages. If a service runs for 1,000 hours and fails five times in that span, MTBF sits at 200 hours. The higher the value, the more reliable the service.
Where MTTR answers "how fast back up?", MTBF answers "how often down at all?". Together they paint a fuller picture than uptime alone: two services can share the same uptime, one with a single long rare outage, the other with many short ones. For the client, those two feel very different.
What this means for your client contract: MTBF shows up in the SLA less often than uptime or MTTR, but it is the early-warning signal for your operation. When MTBF falls, outages are clustering, even if the uptime figure still looks fine. Watch MTBF and you spot a crumbling system before it breaks the uptime promise, letting you act before the client calls.
SLA, SLO and SLI: the promise and its parts
These three acronyms get mixed up constantly, but they stack cleanly on top of each other:
An SLI (Service Level Indicator) is the raw measurement, for example the measured uptime of 99.95 percent last month. It is the bare number.
An SLO (Service Level Objective) is the internal target for that measurement, for example "we want to hold at least 99.9 percent." It is the bar you set for yourself.
An SLA (Service Level Agreement) is the contractual promise to the client, including consequences for missing it, for example a credit when uptime drops below 99.9 percent. It is the promise with teeth.
What this means for your client contract: Set your internal SLO stricter than the SLA you promise the client. If you aim for 99.95 percent internally but only commit to 99.9 percent contractually, you have a buffer. That way you notice internally when it gets tight, without immediately breaching a contractual line. For how to manage and monitor SLA targets per client, see the SLA management page.
How the terms work together
Explained one by one, each term reads like an isolated number. In the client contract, they interlock:
Uptime is the headline promise, the percentage commitment. The nines are its shorthand, making it quick in a sales pitch to say which tier you mean. Downtime and its error budget tell you how much outage that promise actually allows. MTTR caps how long a single incident may last. MTBF warns you when outages start clustering. And SLA, SLO and SLI form the frame that orders all these numbers, from internal target to contractual promise.
Master these terms and you sell monitoring not as technology, but as a promise you can stand behind. The client is not buying percentages, they are buying the certainty that someone is watching their site and will respond fast when it matters. The metrics are the proof you put on the table at month-end.
The last step is turning those numbers into something the client understands without explanation. That is exactly what a clean monthly report does, pulling uptime, incidents and recovery times into one place. For how to build an SLA report for your clients step by step, see the linked post.
If you want to look up a single term again at leisure, you will find each metric on its own in the monitoring glossary.
Frequently asked questions
Uptime is the share of time a service was reachable and working, usually shown as a percentage over a period. 99.9 percent uptime across a month means roughly 43 minutes of outage were allowed. For your client contract, uptime is the number you promise and have to prove at the end of the month.
MTBF measures how long a service runs on average between two failures, so it tracks reliability. MTTR measures how long it takes on average to fix a failure, so it tracks recovery speed. You want MTBF high and MTTR low. Contracts often carry an MTTR promise because it caps how long a client sits with a broken site per incident.
The nines are shorthand for uptime tiers: two nines is 99 percent, three nines is 99.9 percent, four nines is 99.99 percent. Each extra nine cuts the allowed outage budget by a factor of ten. Going from three to four nines sounds minor but marks the gap between roughly 43 minutes and roughly 4 minutes of outage per month.
99.9 percent uptime allows roughly 43 minutes of downtime per 30-day month, and roughly 8.8 hours per year. That figure is your error budget: the amount your site can go down without breaking your promise. Knowing the limit lets you plan maintenance and deployments inside the budget on purpose.
Because they turn the service promise into something measurable. Uptime states how much availability you commit to, MTTR caps the fix time per incident, MTBF describes expected reliability. An SLA without these numbers is a promise with no yardstick. With them, the client can see at month-end whether you delivered.
An outage only counts once it is confirmed from several European locations, not on the first failed check from a single node. A brief network blip at one location does not open an incident. The uptime percentages come from the ratio of successful checks to total checks over the chosen period (day, month, year), visible in the per-monitor uptime stats. So the number reflects real reachability instead of measurement noise.

Co-Founder of Uptimeify, responsible for all of marketing. He bridges technical development and marketing strategy: from Java, PHP and Shopware plugins to steering digital growth strategies. A certified UX Manager (IHK) and digital-marketing advisor to three non-profit organizations.


Google shows sources you mark as preferred more often in its answers.
More from the blog

How to Calculate Uptime: What 99.9% Really Means in Downtime
Turn any SLA percentage into real downtime, and learn what the number actually promises in a client contract.
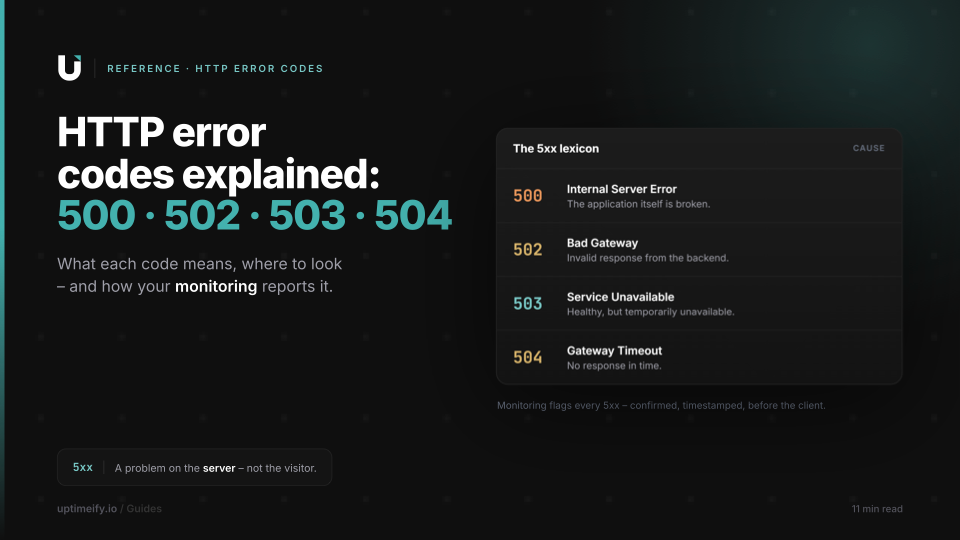
HTTP Error Codes Explained: 500, 502, 503, 504 and What They Mean for Your Clients
An error reference for the key HTTP 5xx codes: cause, fix, and how monitoring reports the error before your client calls.

"Site Unreachable" While the Server Runs: When DNS Is the Problem
Why a site looks "down" while the server runs fine, DNS hijacking, expired delegation, wrong records, and how to catch it early.