
How to Calculate Uptime: What 99.9% Really Means in Downtime


"99.9% uptime" means 8.76 hours of downtime per year, or about 43 minutes a month. You calculate uptime with one simple formula: (total time − downtime) ÷ total time × 100. The real question isn't the arithmetic, though. It's what the number means inside a client contract, and which minutes count as downtime in the first place. This article turns every SLA nine into hours and minutes, and shows you what to watch before you sign.
How to calculate uptime: the formula in one line
Uptime is the share of time a system was reachable, divided by the total time observed, expressed as a percentage. The formula:
Uptime (%) = (total time − downtime) ÷ total time × 100
A worked example for a 30-day month. The month has 30 × 24 × 60 = 43,200 minutes. If a site is down for 22 minutes that month, you get (43,200 − 22) ÷ 43,200 × 100 = 99.95%. Mathematically, there's nothing more to it.
The fight in a contract never starts over the formula. It always starts over a single word: downtime. Does planned maintenance count? Does a site that loads but whose checkout hangs count? Does the clock start at the first failed check or at confirmation? Each of those definitions moves the result, which is why an SLA is a definition document, not a spreadsheet.
The nines table: SLA percentages translated into real downtime
Here's the conversion you came for. Each row shows how much downtime a given uptime level allows across different periods. Values are rounded and assume continuous operation (24/7, 365-day year).
| Uptime | Downtime / year | Downtime / quarter | Downtime / month | Downtime / week | Downtime / day |
|---|---|---|---|---|---|
| 99% ("two nines") | 3.65 days | 21.6 h | 7.2 h | 1.68 h | 14.4 min |
| 99.5% | 1.82 days | 10.8 h | 3.6 h | 50.4 min | 7.2 min |
| 99.9% ("three nines") | 8.76 h | 2.16 h | 43.2 min | 10.1 min | 1.44 min |
| 99.95% | 4.38 h | 1.08 h | 21.6 min | 5.04 min | 43.2 sec |
| 99.99% ("four nines") | 52.6 min | 13.0 min | 4.32 min | 1.01 min | 8.64 sec |
| 99.999% ("five nines") | 5.26 min | 1.3 min | 25.9 sec | 6.05 sec | 0.86 sec |
Two things jump out. First: the leap from 99% to 99.9% is huge: from three and a half days down to under nine hours of annual downtime. Second: from 99.99% up, you're talking minutes per year, a number a single badly-timed incident can eat whole.
Why every extra nine cuts your error budget by 90%
Each additional nine lowers the allowed downtime by exactly 90%. That's not a rule of thumb. It falls straight out of the math: allowed downtime is (100% − uptime). From 99.9% to 99.99%, that remainder drops from 0.1% to 0.01%, one tenth. The window that's left is your error budget: the downtime you can "afford" without breaching the SLA.
The catch: operational cost doesn't rise linearly, it rises faster. Getting from 99% to 99.9% takes solid hosting and fast alerting. Getting from 99.9% to 99.99% takes redundancy, automatic failover, and a reaction time measured in minutes, around the clock. The last nine often costs more than all the others combined.
For agencies and MSPs that means one thing: promise the nine you can actually hold in production, not the one that sounds good in the pitch. A broken 99.99% promise costs you more trust than an honest 99.9% one ever earned.
The measurement window matters more than the percentage
The same percentage means a completely different promise depending on the measurement window. 99.9% measured monthly is markedly stricter than 99.9% measured yearly, because a long incident averages out over a year, but not over a single month.
An example: a site goes down for six hours in March and runs flawlessly the rest of the year. Measured over the year, you land around 99.93%, SLA held. Measured over March alone, around 99.2%, SLA clearly breached. Same incident, opposite verdict. The only difference is the denominator in the formula.
For client contracts, monthly measurement is usually the fairer call: it's transparent, it matches the monthly report your client expects anyway, and it stops a bad month from disappearing under a good year. Write the measurement window into the contract as explicitly as the percentage itself, otherwise you'll argue about the denominator when it counts.
What really matters in a client contract: the definition of "downtime"
The percentage is the visible part of an SLA. The expensive part is in the fine print: in the definition of which minutes count as downtime at all. Three points to settle before any signature.
Planned maintenance. Technically, even announced maintenance is downtime. Common practice is to exclude defined, pre-communicated maintenance windows from the uptime calculation. In Uptimeify you schedule a maintenance window for that: the affected monitor is then treated as "in maintenance", fires no alerts, and appears on the status page as Maintenance instead of an outage. Your report stays aligned with what the contract excludes.
Partial failures. A site that answers with 200 OK but whose checkout hangs is down for the customer, but "online" for a simple ping. Define what "available" means: reachability, or function. Multi-step browser flows that click through a real purchase turn "the server responds" into a dependable "the function works".
When the downtime clock starts. Does it start at the first failed check, or at confirmation from multiple locations? Uptimeify confirms every outage from multiple EU locations before opening an incident, so a single network hiccup at one node triggers no alert and no counted downtime. That protects your stats from false alarms that would otherwise write phantom downtime into the report.
From number to proof: reporting uptime cleanly
A calculated uptime figure is only worth as much as the evidence behind it. When your client reads "99.95%" at month's end, that number has to come from real measurement data, not an estimate. This is where the claim parts ways with the proof.
The clean workflow: measure continuously from multiple locations, exclude planned maintenance properly, document real outages with timestamps, and roll it all into a month-end report that shows the calculated uptime, the incidents, and the periods. In Uptimeify that report runs white-labeled, your logo, your brand, and generates automatically as a PDF. The abstract nine becomes a monthly proof of your value that no client questions.
That's the real reason to understand the nines: not to dazzle a pitch with "99.99%", but to promise a number you measure, hold, and prove, month after month.
Frequently asked questions
Uptime = (total time − downtime) ÷ total time × 100. Example: in a 30-day month (43,200 minutes) with 22 minutes of downtime, that's (43,200 − 22) ÷ 43,200 × 100 = 99.95%. The only lever anyone argues about in a contract is the definition of "downtime": whether planned maintenance, partial failures and the time to react to an alert count against you. That's exactly what your SLA defines.
99.9% uptime allows roughly 8.76 hours of downtime per year, about 43 minutes per month, or just over 10 minutes per week. As an annual figure it sounds comfortable, but a single longer incident on a bad afternoon already blows the monthly budget. That's why you measure monthly, not just across the year.
Going from 99.9% to 99.99% cuts allowed downtime from 8.76 hours to 52.6 minutes per year, a factor of ten. Every extra nine shrinks the error budget by 90%. Per month that's 43 minutes at 99.9% versus about 4 minutes at 99.99%. The second number is far more expensive to hold in production and should never end up in a contract lightly.
That depends entirely on your SLA definition: technically, maintenance is downtime like any other. Common practice: announced maintenance inside defined windows doesn't count against uptime. In Uptimeify you schedule a maintenance window for exactly this; the affected monitor is then treated as "in maintenance", fires no alerts, and shows up on the status page as Maintenance instead of an outage. That keeps your report clean and aligned with what the contract carves out.
The measurement window belongs in the contract just as much as the percentage itself. The same 99.9% measured monthly is stricter than measured yearly, because a long incident averages out over a year but not over a single month. For client contracts, monthly measurement is usually the fairer, more transparent choice, and it lines up with the monthly report your client already receives.

Co-Founder of Uptimeify, responsible for all of marketing. He bridges technical development and marketing strategy: from Java, PHP and Shopware plugins to steering digital growth strategies. A certified UX Manager (IHK) and digital-marketing advisor to three non-profit organizations.


Google shows sources you mark as preferred more often in its answers.
More from the blog

Uptime, MTTR, MTBF and the Nines: Monitoring Terms in Plain English
The monitoring terms that matter, each explained with what it means for your client contract.

Monitoring Strategy for a Client Portfolio: what, how often, and from where
The decision framework for your client portfolio: which monitor types per client, which intervals, which alert thresholds.
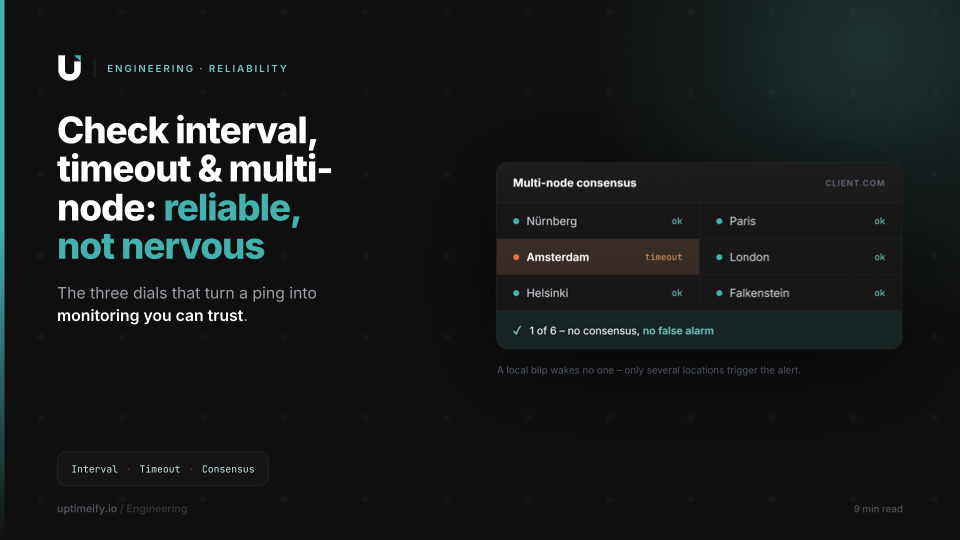
Check Interval, Timeout and Multi-Node: How Reliable Monitoring Actually Works
Check interval, timeout profiles and consensus across several EU locations: the three dials that turn a bare ping into monitoring you can trust.