
Monitoring Strategy for a Client Portfolio: what, how often, and from where


A monitoring strategy for a client portfolio answers three questions per client: what you monitor, how often you check, and at what threshold you alert. The short answer: stagger everything by the damage an outage does to each client, instead of pushing every monitor to the technical maximum. A revenue-critical shop deserves 30-second checks and instant escalation. An internal staging environment does not. This guide gives you the decision framework to find the right combination for each client, without drowning your team in alert fatigue.
Why a strategy beats gut feeling
Without a strategy, every agency monitors by gut feeling, and gut feeling drifts in two directions: either every client is treated the same, or everything gets pushed to the maximum. Both cost you. Treating everyone the same means checking the 5,000-dollar retainer shop with the same coarse 15-minute interval as the free internal blog, so an outage surfaces hours too late. Pushing everything to the maximum means running every monitor at a 30-second cadence, flagging every blip, and flooding your team with false alarms until it trusts no alert at all.
A monitoring strategy orders these decisions along a single axis: the business value of the monitored asset to your client. What, how often, when, and from where all follow from that one question. That makes the decision repeatable. A new client gets sorted, not reinvented. And it makes the decision sellable, because you can tell the client why their shop is watched more tightly than their newsletter archive.
What to monitor: monitor types by client type
The right monitor mix depends on the client's business, not on a standard checklist. An uptime check alone only tells you the server responds, not that the client is making money. A shop whose cart silently drops to a blank page still returns HTTP 200 while revenue sits at zero. So you choose monitors by what can actually break for the client.
Uptimeify covers the full range from one dashboard: websites (uptime, SSL certificate, response time, keyword presence, page size, HTTPS redirect), servers and services (DNS, ICMP/ping, SSH, FTP, SMTP, IMAP/POP, DNSBL blacklist, domain expiry), plus synthetic and scheduled checks (multi-step browser flows with Playwright, and heartbeat checks for cron jobs). The skill is not switching everything on. It's hitting the relevant core per client.
As a guide to which types belong to which client business:
| Client type | Must-have monitors | Complementary | Why |
|---|---|---|---|
| E-commerce / shop | Uptime, SSL, response time, keyword check (cart) | Playwright checkout flow, page size | A silent checkout failure costs revenue directly, a 200 is not proof enough |
| Marketing / corporate | Uptime, SSL, HTTPS redirect | Keyword check (core message), domain expiry | Availability and a valid certificate are the minimum for the brand image |
| Client with mail server | SMTP, IMAP/POP, DNSBL blacklist | DNS, SPF/DKIM-adjacent domain checks | Delivered mail is business-critical, and a blacklist listing goes unnoticed otherwise |
| Client with own infrastructure | ICMP/ping, SSH, DNS, uptime | FTP, heartbeat for cron jobs | Server reachability and admin access have to work quietly |
| SaaS / web app | Uptime, Playwright login flow, response time | Heartbeat, keyword on dashboard state | An app is only online once the user can actually log in |
Two monitor types belong in almost every profile, because their failure is predictable and still embarrassing: SSL monitoring catches expiring certificates before the browser locks the client out, and domain-expiry monitoring warns you about the forgotten renewal that takes a whole brand offline. Both cost you next to nothing and spare you the call no agency wants to make.
How often to check: stagger intervals by outage cost
The check interval determines how fast an outage surfaces, and you stagger it by the cost per minute of downtime, not by pushing to the maximum. A tight cadence shortens time to detection but raises background noise and load. The right value is the one where detection is fast enough for the client's business, and not a tick faster.
As a starting grid you refine per client:
| Interval | For which clients | Logic |
|---|---|---|
| 30 to 60 seconds | Revenue-critical: shops, booking, checkout, payment flows | Every minute of downtime costs money, detection in minutes not hours |
| 1 to 3 minutes | Important client sites with an SLA commitment | Fast enough for the SLA without generating background noise |
| 5 minutes | Marketing sites, landing pages, blogs | Availability matters, but seconds decide nothing |
| 15 minutes | Internal tools, staging, non-critical side sites | An outage is annoying but not business-critical |
Per monitor you set check interval and timeout separately. The interval controls how often it checks, the timeout how long it waits for a response before the check counts as failed. A slow but reachable site is not an outage, so you match the timeout to the client's actual response time instead of taking a global default. That keeps a fundamentally sluggish site from producing constant suspicions.
The most common mistake is setting everything to 30 seconds because you can. That doesn't make the portfolio safer, only louder. Checking tighter means faster alerts and more background noise, in the same breath. Staggering means putting the speed where it counts.
When to alert: thresholds and escalation
The alert threshold decides whether your monitoring is trusted or ignored, and the most important rule is: never alert on a single failed check. A single blip from one location is network noise, not an outage. Alert on that, and you train your team to dismiss alerts.
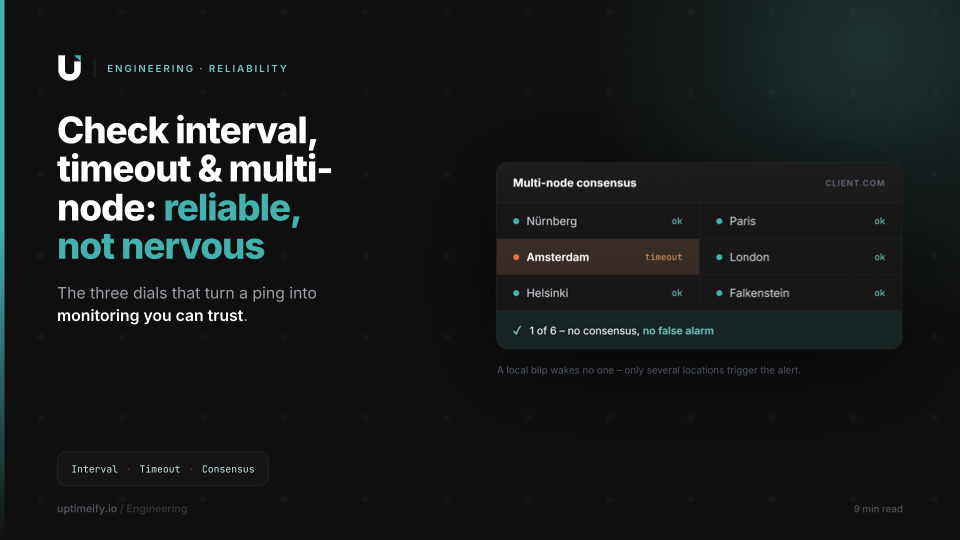
Confirmation is the core. Uptimeify verifies every disruption from several EU locations before an incident opens. When a check fails, additional locations cross-check, and only when they confirm the failure does an incident form. That separates the real outage from the one flaky node, and it's the single biggest lever against false alarms. In the incident timeline you see it as separate timestamps: when the outage was first seen, and when it was confirmed.
Beyond the threshold, escalation decides who learns when. Instead of notifying everyone in parallel on every incident, you stage it, multi-step and time-based: an unacknowledged alert moves on to the next responder after a set interval. Uptimeify routes alerts across 29 notification channels, including Slack, Microsoft Teams, PagerDuty, Opsgenie, SMS, email, and webhooks. The practical split across a portfolio:
- Critical clients escalate to SMS or on-call, because minutes count here.
- Important clients report into a dedicated team channel like Slack or Teams.
- Non-critical clients land in a quiet catch-all channel you review once a day.
The third lever against alert fatigue is the maintenance window. When you schedule a deployment or a migration, you suppress the affected monitor's alerts for the planned window instead of waking your team with expected outages. Maintenance windows apply per monitor, per day, or to an entire client, and can recur for the weekly update slot.
Where to check from: locations and their effect
The check location affects two things: the measured latency and your GDPR case. For a European client portfolio you want to check from Europe, because the measurement then reflects the experience of your actual users, not the detour latency of a US location.
Uptimeify polls from nine European locations: Nuremberg, Falkenstein, Frankfurt and Berlin in Germany, plus Logroño, Paris, Warsaw, Milan, and Helsinki. That spread serves two purposes at once. First, the confirmation logic from the last section: multiple locations cross-check a suspected failure before an incident forms, and that needs real geographic spread, not two servers in the same data center. Second, proximity: a check from Nuremberg for a Frankfurt client measures realistic response times, not transatlantic background noise.
The location doubles as a trust argument. Uptimeify is built and hosted in Frankfurt, European infrastructure with no US sub-processors. That's not a legal promise, it's a fact about the architecture, and that's exactly why it holds: it doesn't age with the next court ruling. For clients in the public sector, healthcare, or the regulated mid-market, that substance takes an entire discussion about third-country transfers off the table in the pitch. You don't just monitor from Europe, you can prove it.
The framework in three client profiles
The framework gets concrete the moment you lay it over real clients. Three profiles show how what, how often, and when work together, instead of being decided one at a time.
Profile A: the revenue shop. An e-commerce client on a 5,000-dollar retainer with direct revenue per minute of availability. Monitors: uptime, SSL, response time, a keyword check on the cart, and a Playwright flow through checkout. Interval: 30 to 60 seconds on the critical paths. Threshold: confirmation from multiple locations, then instant escalation to SMS and on-call. Maintenance windows for every planned deployment, so the night releases don't wake the on-call phone.
Profile B: the marketing site. A corporate client with no transactions but a brand to protect. Monitors: uptime, SSL, HTTPS redirect, a keyword check on the homepage's core message, domain expiry. Interval: 5 minutes. Threshold: confirmation from multiple locations, reported into a team channel rather than a phone. No on-call needed, an outage at three in the morning waits until morning.
Profile C: the internal service. A staging server or an internal tool with no end-customer impact. Monitors: uptime, ICMP for server reachability, a heartbeat check for the nightly cron job. Interval: 15 minutes. Threshold: confirmation from multiple locations, a catch-all channel reviewed once a day. This is where staggering pays off directly: this client generates no noise that dilutes the alerts from Profile A.
That's the whole point of the strategy. Because Profile C stays quiet, Profile A stays loud and credible. A portfolio that treats all three the same loses either the speed on the shop or the calm on the staging box. The framework gives each client the profile its business earns, and turns sorting the next new client into a one-minute decision instead of a debate from first principles.
Document it cleanly, and the strategy becomes a sales argument in its own right: the monthly SLA report shows the client in black and white that their shop is watched more tightly than their blog, and proves, month after month, what they're paying for.
Frequently asked questions
As often as the cost of downtime justifies, not as often as technically possible. Revenue-critical shops and booking systems belong at a 30-second to 1-minute cadence, so an outage surfaces in minutes instead of hours. Marketing sites and landing pages are fine at 5 minutes. Internal tools and staging are fine at 15 minutes. Tighter checks mean faster alerts, but also more background noise. Stagger the interval per client type instead of pushing everything to the maximum.
A single failed check is not a reason to alert, a network blip is not an outage. The proven approach is to confirm from multiple locations before an incident opens. Uptimeify verifies every disruption from several EU locations before it alerts you. That way you trigger on real outages, not on one flaky node. For non-critical monitors you can loosen the confirmation, for critical ones tighten it.
It depends on the client's business. A shop needs uptime, SSL, response time, and a keyword check on the cart. A client running their own mail server also needs SMTP, IMAP/POP, and a DNSBL blacklist check. A client with their own infrastructure needs ICMP, SSH, and DNS. Almost every client benefits from SSL and domain-expiry monitoring, because an expired certificate or a forgotten domain renewal is both predictable and embarrassing. Start with the core and expand per client.
Alert fatigue happens when every blip reaches everyone. Three levers against it: confirmation from multiple locations before an incident, staged escalation instead of parallel blanket alerts, and maintenance windows for planned deployments. Route non-critical clients into a quiet channel and send only critical clients to SMS or on-call. A team that still trusts every alert reacts faster than one that dismisses half of them.
Uptimeify polls from nine European locations: Nuremberg, Falkenstein, Frankfurt, Berlin, Logroño, Paris, Warsaw, Milan, and Helsinki. The platform is built and hosted in Frankfurt, European infrastructure with no US sub-processors. That keeps check latency low for European clients and reduces the risk around third-country transfers. In B2B and public-sector pitches, it takes an entire discussion off the table.
Per monitor you set the check interval (minutes) and timeout (seconds) separately. A failed check counts as a suspicion, not an incident. Detection pulls a confirmation from additional EU locations before an incident opens, visible in the incident timeline with outageStartedAt and confirmationAt as separate timestamps. Escalation only fires after confirmation. Recovery runs symmetrically: a successful re-check closes the incident, cross-verified across multiple locations. Timeout, interval, and confirmation logic are tunable per monitor type, from the 30-second uptime check to the hourly domain-expiry check.

Co-Founder of Uptimeify, responsible for all of marketing. He bridges technical development and marketing strategy: from Java, PHP and Shopware plugins to steering digital growth strategies. A certified UX Manager (IHK) and digital-marketing advisor to three non-profit organizations.


Google shows sources you mark as preferred more often in its answers.
More from the blog
Check Interval, Timeout and Multi-Node: How Reliable Monitoring Actually Works
Check interval, timeout profiles and consensus across several EU locations: the three dials that turn a bare ping into monitoring you can trust.

Reduce Churn with Proactive Monitoring: Report the Outage Before Your Client Notices
Monitor client sites proactively and you report the outage first, turning monitoring from a cost line into your agency's strongest retention tool.

Uptime, MTTR, MTBF and the Nines: Monitoring Terms in Plain English
The monitoring terms that matter, each explained with what it means for your client contract.