
Platform Update July 2026: 27 changes, two of them ask something of you


Note, August 2026: this post describes the state as of July 2026. Since August 2026 the fleet runs from nine European locations across Germany, Spain, France, Italy, Poland and Finland. The current list is on Platform and support.
Note, September 8, 2026: the MCP server has since grown a small set of write tools, on top of everything the FAQ below describes, each behind its own consent scope you grant separately, area by area, and unchecked until you check it yourself. Current tool list and scopes are on the MCP server page.
27 changes went live on the platform in July. One of them asks something of you: two of our probe locations have moved, and if you keep our IP addresses in a firewall, you need to read the list in again. The rest is yours to take: a full data export for your entire organization, a dedicated monitor type for TCP ports, a second carrier for SMS and voice alerts, and an engine room that no longer has single points of failure.
What you need to do: new probe locations, new IP list
Uptimeify checks your monitors from several European locations and confirms every outage from more than one of them. Two of those locations moved on 28 July: the nodes in Zurich and Prague are retired, and Frankfurt and Paris take their place. We also added capacity in Milan and Warsaw.
The fleet still covers seven locations, all inside the EU: Nuremberg, Falkenstein and Frankfurt in Germany, plus Paris, Warsaw, Milan and Helsinki. What changed is the country list. Checks no longer start from Switzerland or Czechia, and France joins instead. Nothing about where your data lives or how it is processed changes.
Two things are worth a look if you look after client infrastructure:
| Check | Why |
|---|---|
| Firewall allowlists on your client servers | The addresses of the retired nodes are gone from uptimeify.io/ips.txt, and the new ones are in there. That file is the authoritative list. If you keep a copy by hand, read it in again now. |
| Monitors with a country restriction | A monitor set to check exclusively from Switzerland or Czechia has no location left to run from. |
Your data belongs to you: an export for the whole organization
Until now you could export the check history of a single monitor from its detail page. Since 30 July an admin can export everything the organization holds in one go: clients, monitors of every type, incidents and their updates, maintenance windows, notification channels, tags, status pages, reports including run history, billing data, team members, API token metadata, the configuration and history of incident management, and the raw check history behind your monitors.
You will find the export in the dashboard under Settings, Data Export, and in the API under POST /api/organization/data-export. Every record is written twice, as JSON for a faithful re-import and as CSV for your spreadsheet, plus a manifest.json listing each section with its row count. That way you can verify completeness without opening a single file.
Two things limit the content, and both are documented inside the package itself. Time series reach back as far as the data retention included in your plans allows. Older rows are not withheld, they simply no longer exist. And credentials never leave the platform: passwords, webhook secrets, integration tokens, API token hashes and SMTP passwords are replaced by a redaction marker while the surrounding record is exported in full.
The ZIP is written to our object storage at Hetzner in Germany, the same storage that already holds report PDFs and branding assets. The download runs through an authenticated request that issues a link valid for five minutes, and the bucket itself is not browsable. Seven days after creation the file is deleted automatically. The export costs nothing extra, and you can request one every six hours.
In the same move we put the lifecycle for unpaid trial accounts in writing: monitoring pauses 14 days after signup, a warning email goes out seven days before deletion, and 30 days after pausing the account and its data are deleted. Anyone who adds a payment method, at any point, is fully exempt. The data export stays reachable across the whole period, even after monitoring pauses.
Newly monitorable: TCP ports, with and without credentials
Since 12 July there is a dedicated TCP port monitor type. Point it at any host and port, and we check from our European fleet whether the port accepts a TCP connection within your timeout. Optionally we also check whether the service's first reply, its banner, contains an expected piece of text. No credentials required.
On top of that comes a "port only" check mode for the existing SSH, SMTP, FTP and IMAP monitors. In this mode the monitor performs the same pure TCP reachability check instead of a full protocol handshake with login. For agencies that is the practical part: you can watch a client's mail server without anyone writing a password into a ticket. The default mode with the full handshake stays unchanged for every existing monitor.
Also new is an ownership class per monitor, across all types. Managed behaves exactly as before: your organization runs the monitor, and the full escalation applies. Self-service sits with the end client. Users in the client portal create these monitors themselves within their quota, edit and delete them, and alerts go only to that client's recipients. Organization-wide integration channels such as webhooks, OpsGenie or your own SMTP channel stay out of it. Every existing monitor was classified as managed, so nothing changed for any running monitor.
Alerting: two carriers instead of one, and one address for everything legacy
SMS and voice calls are the last line of alerting. They reach a human when email and chat do not. Until now both ran through a single provider. That left the loudest part of alerting depending on one supplier being available at exactly the moment it matters most.
Since 17 July, LOX24 has been in place as a second provider on cold standby: every message goes out through seven.io first, and LOX24 only steps in when seven.io cannot deliver. Two independent carriers, two independent failure modes. All that gets handed over is the recipient's phone number and the text of the notification.
There is also a new email-based alert source. You can forward an alert email from any tool that sends alerts by email to a dedicated address under @ingest.uptimeify.io, and it becomes an incident, exactly like a webhook alert does. A legacy on-call system, a provider without webhooks, an internal script: anything that can send mail now lands in the same escalation as everything else.
And because we monitor our own production with Uptimeify, since 27 July the deployment pipeline opens a maintenance window for the affected monitors right before the application container is swapped, and lifts it again 30 seconds after the release. During a release our status page shows planned maintenance instead of an incident. If a release fails, the pipeline lifts the window immediately so real alerts take effect again.
For AI agents: read access, cleanly scoped
The MCP server at https://uptimeify.io/mcp gained three tiers in July. Anonymously it offers around twenty free diagnostic tools: SSL and TLS checks, DNS and mail deliverability checks for SPF, DKIM, DMARC and MX, analysis of HTTP headers and redirects, WHOIS, plus blacklist and reachability checks. No account and no login required.
With an API token or over an OAuth connection, an agent additionally reads your own data: list website monitors, fetch current status, view recent incidents, pull check history and an availability summary. Access is scoped exactly as it is in the REST API. A client-bound token sees only that client's data, an organization token sees the whole organization. Every tool this post describes is read-only, none writes. A separate set of write tools now exists, off unless you grant its consent scope yourself.
Connected applications now appear under Settings, Connected Applications, and you can revoke access there at any time. Revoking disconnects the application immediately, and reconnecting requires a fresh approval. If you want agents to work without an account of their own, the same origin hosts an authorization server for agentic registration including a confirmation ceremony through the /claim page. That path, too, ends at a token that can only read.
What happened in the engine room
The rest of the month is infrastructure. None of it needs your attention, and all of it shows up as nothing happening.
- Database on a cluster. The primary database moved from a single-node container to a Patroni-managed, highly available PostgreSQL and TimescaleDB cluster with automatic leader failover. Provisioning and backups run through a dedicated infrastructure-as-code stack, separate from ordinary releases.
- Queue and cache on a cluster. Check scheduling, alert delivery, reports and caching used to hang off a single Redis instance. They now sit behind a Redis Sentinel cluster across three nodes: if the primary node fails, a replica is promoted and the workers reconnect automatically.
- Deployments with a prebuilt image. Releases are no longer compiled on the application server, they are built and tested in CI. The server only pulls the finished, version-pinned image. Shorter deployments, a smaller maintenance window, and the same artifact can be rolled out to multiple application servers.
- Application server without customer data. The unused local database and cache containers on the application server are switched off. The host now stores no customer data at all.
- More robust DNS resolution. Under load spikes our local resolvers could briefly hit their capacity limit and return a temporary resolution error, which some checks read as "target unreachable". We raised the concurrency headroom and widened the retry window. A genuinely unresolvable domain still fails immediately and alerts as before.
- Unified check engine. The protocol-specific workers now run on a shared, hardened engine, including SSRF protection and a uniform connection retry. Response times for SMTP, SSH, FTP and IMAP checks now measure the protocol connection itself, without DNS resolution. Values may therefore come out slightly lower and more consistent. DNS monitors comparing long TXT records, for example DKIM keys over 255 characters, now match correctly.
- Alerting details. Maintenance windows suppress DNSBL notifications reliably, DNSBL and domain expiry alerts go to all integration channels, and redirect loops are verified with a real browser before the alert and come with a screenshot as evidence.
New and switched subprocessors
Nine entries moved in July. Registered office and role in short form below, and the full list lives on the subprocessors page.
| Provider | Office | Role | Status |
|---|---|---|---|
| netcup GmbH | Germany | hosts additional monitoring check nodes | new |
| UpCloud Ltd | Finland | hosts additional monitoring check nodes | new |
| LOX24 GmbH | Germany | SMS and voice alerts in failover | new |
| DNS.SB (xTom GmbH) | Germany | second fallback resolver, replaces Quad9 | switched |
| DNS4EU | EU | fallback resolver | new in July |
| Lettermint B.V. | Netherlands | additionally handles inbound alert forwarding | role extended |
| Ubicloud B.V. | Netherlands | managed CI runners for our build pipeline | new |
| easybell GmbH | Germany | business telephony: SIP trunk and cloud phone system | new |
| fastmon and Leadfeeder | Germany | real user monitoring and visitor analytics for the website | new |
Three notes that do not fit into a table. First: moving from Quad9 to DNS.SB puts our second fallback resolver entirely inside the EU. DNS.SB is an unfiltered resolver with no query logs, and no lawfully operated domain is blocked. Second: with Ubicloud the contracting party is the Dutch entity, but the parent company is based in the US. A US access path therefore cannot be fully ruled out, and it is covered by standard contractual clauses. Ubicloud processes our source code and build secrets, not customer monitoring data. Third: fastmon and Leadfeeder touch only our public website and the web application, no monitored URLs, no check results, no alert content.
What comes next
Work on redundant application servers continues. With the prebuilt image and the two clusters in place, the groundwork for running the app across more than one host is done. What is concretely planned is on the roadmap. We put dates there where they hold.
Every change from this month with its date and full wording is in the changelog. Why the location of probe nodes is more than a detail for European customers is covered in our post on polling nodes in the EU.
Frequently asked questions
Only if you allowlist our probe nodes in a firewall or if you have monitors pinned to specific countries. The authoritative IP list lives at uptimeify.io/ips.txt and is already updated: Zurich and Prague are out, Frankfurt and Paris are in. If you keep a copy by hand, read it in again. A monitor set to check exclusively from Switzerland or Czechia no longer has a location and needs a new country selection.
Everything your organization holds: clients, monitors of every type, incidents including their updates, maintenance windows, notification channels, tags, status pages, reports with their run history, billing data, team members, API token metadata, your incident management configuration and the raw check history. Every record is written twice, as JSON for re-import and as CSV for your spreadsheet, plus a manifest.json with the row count per section. Credentials and secrets are redacted and never leave the platform.
One every six hours, at no extra charge. The ZIP sits in our object storage in Germany, and the download runs through an authenticated request that issues a link valid for five minutes. Seven days after creation the file is deleted automatically.
Monitoring pauses 14 days after signup, a warning email goes out seven days before deletion, and 30 days after pausing the account and its data are deleted. That is 44 days in total. Anyone who adds a payment method at any point, including mid-trial, is fully exempt. The data export stays reachable across the whole period, even after monitoring pauses.
Not by default. Every tool this post describes only reads, both with an API token and over OAuth: an agent can list monitors, read status, pull incidents and check history, and fetch an availability summary. A separate set of write tools has since been added behind its own consent scope, granted apart from read access and unchecked until you check it yourself, so nothing here changes unless you grant that scope. Access is scoped exactly as it is in the REST API, and you can revoke it any time under Settings, Connected Applications.
Yes. The database and queue layer run on dedicated hosts inside our European infrastructure and are reachable only over our private network, and the platform stays hosted in Germany. Since the rebuild the application server stores no customer data at all. No new provider was added for these layers.

Co-Founder of Uptimeify, responsible for all of marketing. He bridges technical development and marketing strategy: from Java, PHP and Shopware plugins to steering digital growth strategies. A certified UX Manager (IHK) and digital-marketing advisor to three non-profit organizations.


Google shows sources you mark as preferred more often in its answers.
More from the blog

Platform Update August 2026: nine check locations and alerts that name the blocker
Two new check locations, alerts that name who refused the request, status page subscriptions and our own measured availability: every August change in one post.

MCP Server Security: Read-only, Token Scopes and Human Approval
Why an AI agent can read your Uptimeify data but has no structural path to write anything.
Check Interval, Timeout and Multi-Node: How Reliable Monitoring Actually Works
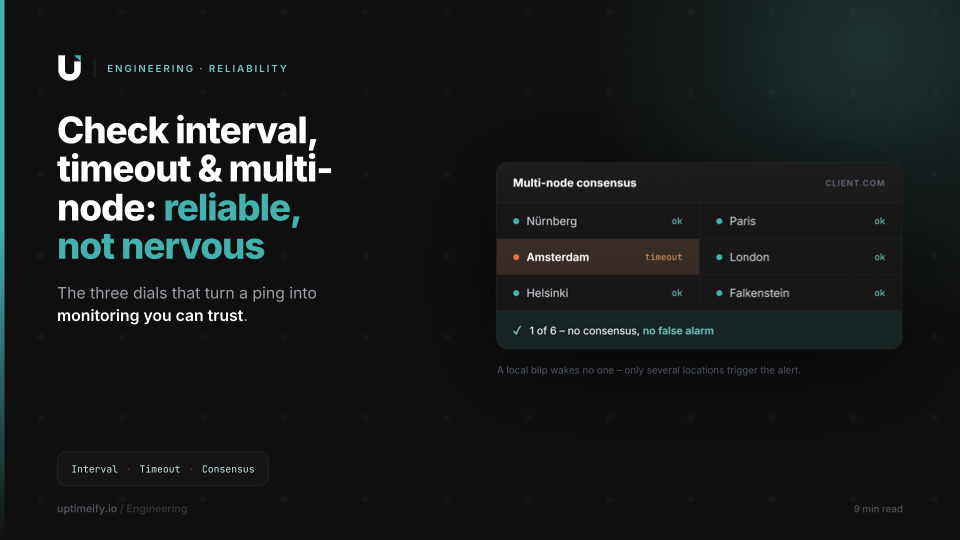
Check interval, timeout profiles and consensus across several EU locations: the three dials that turn a bare ping into monitoring you can trust.