
Platform Update August 2026: nine check locations and alerts that name the blocker


Twenty eight platform changes went live in August. Two of them ask something of you: the fleet grew to nine check locations, so anyone allowlisting our IP addresses in a firewall reads the list again, and anyone feeding alerts in by email picks up an address on the new domain once. The rest is yours to take: alerts that name the blocker, a header that lets you allowlist us without touching an IP list, subscriptions for your status pages, and an availability figure for our own service that we measure rather than assert.
What you need to do: the IP list and one address
Berlin and Logroño joined the fleet on 2 August. Both run on IONOS Cloud and both sit inside the EU. The four new IPv4 addresses and their IPv6 counterparts were in uptimeify.io/ips.txt before either node took traffic. That head start is the point: an address your firewall does not know looks exactly like an outage that is not happening.
The second item concerns email alert sources only. The address you forward alert emails to now lives on alerts.uptimeify.io instead of ingest.uptimeify.io. Nothing about the feature changes, the name simply says what you send there. Webhook alert sources from Zabbix, Datadog, Grafana, Prometheus Alertmanager or Sentry are untouched.
| Check | Why |
|---|---|
| Firewall allowlists on your client servers | The Berlin and Logroño addresses are in uptimeify.io/ips.txt. That file is the authoritative list. If you keep a copy by hand, read it again now. |
| Existing email alert sources | If you hold an inbound address on the old domain, create a fresh email alert source. You get one on alerts.uptimeify.io. |
Spain is new to the country list. Until now checks originated from Germany, Finland, France, Italy and Poland. Monitors that restrict checks to specific countries can pick Spain, which matters most for Iberian endpoints where the nearest node used to be Paris or Milan. Both locations appear as their own components on our status page, with their own availability and their own measurement coverage. Nothing about where your data is stored changes: the platform stays hosted in Germany.
Alerts now name who refused the request
A 503 tells you that something refused the request. It does not tell you whether deinkunde.com is down or whether a web application firewall sorted our check out before it ever reached the server. Until now we stored only the status code, and that question could not be answered without someone reading our logs.
Since 20 August, a check answered with 403, 406, 429 or 503 keeps the response headers that identify the sender: server, cf-ray, x-sucuri-id, x-iinfo, retry-after and a handful of their relatives. Where those headers name a known provider, we say so by name, for example Cloudflare, Sucuri, Imperva, DataDome, Akamai or Fastly. When nothing in the response names anyone, we say nothing rather than guess.
You will find it in three places: the evidence section of the incident detail, an extra block in the alert email, and a new blocking_response field inside error_details in the JSON webhook payload. Existing webhook fields are unchanged, so nothing you have built against them breaks.
What we deliberately do not keep: the header list is a fixed allowlist. Cookies, authorization and authentication headers are never stored and never sent onward, and every value is truncated. A response we record is a response we may hand onward, so it carries only what identifies a block.
Every check identifies itself, browsers included
Our simple checks for HTTP, SSL and redirects have always carried SiteMonitorBot in the user agent. The browser based checks did not: screenshots and Playwright monitors arrived as anonymous Chrome and were indistinguishable from an ordinary visitor in your access log. That was fixed on 4 August.
Browser based checks now carry our token at the end of a normal Chrome user agent string. We append rather than replace on purpose. A Playwright monitor walks a real user journey, a login, a checkout, and a great many WAFs block a bare bot user agent outright. If that happened, we would report an outage your visitors are not experiencing.
The more reliable of the two signals is the second one. Every check also sends the header X-Uptimeify-Monitor: 1. A CDN or reverse proxy can rewrite a user agent, an extra header far less often. The value is a constant and never carries a monitor, customer or account identifier. If you do match on the user agent, match on the substring SiteMonitorBot and never on the full string, which carries a Chrome version that changes with every browser update.
Our bot page also moved to uptimeify.io/robot and was rebuilt around the questions people actually arrive with. Each client has a spec card listing user agent, extra header, frequency and source addresses, the address list is generated live from the active fleet rather than maintained by hand, and a table maps what you see in a log line to what it is and what to do about it. Newly documented is UptimeifyToolsBot, the client behind our free tools and the anonymous checks our MCP server exposes. On the same page you can enter a domain and have us request it with the real SiteMonitorBot user agent to see what your server answers. If a bot rule is blocking our monitoring, that is where you see it, before it shows up as an outage that is not happening.
An unstable monitor produces one incident, not dozens
When a site alternates between healthy and failing, our flap detection has always recognised the state and stopped sending an alert for every swing. What it did not stop was the incident record itself: each swing opened a fresh incident, which resolved, which opened again. One monitor in that state produced around 110 incidents in eight hours.
Since 20 August, while a monitor is flapping, a new failure of the same cause reopens the incident already on record. The incident stays open for as long as the episode lasts and keeps its original start time, so its duration is the duration of the instability. A different cause, a certificate problem appearing during an outage episode for instance, still gets its own incident.
Your availability figures do not move. Uptime is calculated from the check results themselves, never from the incident list, so a merged incident changes no percentage on any report or status page.
In the same stretch we closed a gap on short intervals. Ping and IMAP/POP monitors set to a one minute interval were missing roughly 12 percent of their checks, and not at random: always in the same twelve minutes of every hour, at all nine locations at once. The scheduler had recorded, per monitor, the moment it dispatched the last check. When a cycle started a few seconds past the minute, the previous check was formally not yet a minute old and the monitor counted as not due. The scheduler now records the minute a check belongs to, and the same rule applies to every monitor type. Run a one minute interval and you get the full 60 cycles per hour. The checks missed in the past are gaps and cannot be backfilled.
Status pages with subscriptions: email and RSS
Public status pages have offered email and RSS subscriptions since 8 August. Email subscriptions use double opt-in: an address receives nothing until it has been confirmed from the confirmation email.
Where an organisation has configured its own SMTP server, every subscription email goes out through it. Without one, delivery uses Lettermint, our existing email subprocessor, so no new provider is involved. As proof of consent we store the address, the timestamp, the IP address and the user agent recorded at signup. Unconfirmed signups are deleted after seven days. Page operators can switch subscriptions off per status page in the settings.
For an agency this is the difference between a page a client has to remember to open and a message that reaches them before they reach for the phone. The sender is yours.
We measure and publish our own availability
We ask you to trust a number we produce about your systems. It is only fair that the number we produce about our own is measured the same way and visible without you asking us for it.
What we measure is check delivery: the share of the check cycles our network was scheduled to run that it actually ran. A cycle counts as delivered when at least one of our locations ran it, and only a cycle that produced no check anywhere subtracts. Announced maintenance is not excluded: a maintenance window suppresses alerting, not scheduling, so your checks really do run during one.
Next to that figure sits a second one, measurement coverage: how much of the period we can actually account for. Minutes where the recording stopped or an aggregation did not complete are never assumed healthy and never quietly dropped, they lower the coverage figure. What they are not is downtime. "We were unavailable" and "we could not measure" are different statements. For the conservative reading, multiply the two.
For alerting we publish the share of attempted deliveries that eventually got through, and the p90 time from an incident opening to the first notification that left our systems. Deliveries that fail at the far end, because the endpoint is gone, the credentials were revoked or your service rate limits us, count as endpoint failures and are published beside the figure rather than inside it. Anything we cannot confidently pin on the far end counts against us.
The current trailing 90 day figures, the state of each component and the monthly totals behind them are on our public status page and in machine readable form at uptimeify.io/api/service-status, with no authentication and no customer data. A closed month is frozen and each entry is hash chained to the one before it. Save today's response, and if a past month ever reads differently later, the hash will tell you. The platform uptime figure that used to sit on our landing page came from none of this. We removed it, and it comes back when the measured series is long enough to stand behind.
How long your history sticks around
A monitor that runs every minute from several locations writes a row per location per minute. Kept in full, that is the largest thing we store by a wide margin, and it grows with every monitor you add. It is also almost never what you read: a chart, an uptime figure, a report and a status bar all ask about a minute, a day or a month, not about a single row.
So the rows are now summarised. Every check still produces the same data and the same alert, gets rolled up into per minute, per 15 minute and daily aggregates, and the individual rows are dropped after 48 hours. The aggregates are kept for the retention your package includes, so the same charts, the same uptime and the same monthly and yearly figures cover the same period as before.
What changes is the resolution of two detail views once an entry is older than 48 hours. In the check log and the incident timeline, an older entry is one line per minute instead of one line per location: how many locations were checked and how many failed. Both views mark those entries, and the API returns a resolution field with raw or 1min. Everything inside 48 hours is unchanged, including the evidence kept for an incident, which is copied when the incident is created and outlives the raw rows.
Incident Management has its own clock: twelve months of full detail, then 24 months as a daily aggregate per team and severity carrying counts, time to acknowledge and time to resolve. Twelve months is twice the window most incident tools open by default and covers a full annual cycle. Two consequences come with it. An incident older than twelve months no longer appears in the incident list or the API, including one that was never resolved, and a report reaching past twelve months shows means rather than a p95.
The same change made the read paths faster, because a month of chart data is now a few thousand aggregate rows rather than a full scan of raw ones. The monitor detail page went from 4.6 to 1.2 seconds at p95, and deleting a monitor from 27 to 0.3 seconds.
Everything else that shipped
- HTTP QUERY for monitors. Some endpoints only answer properly when the request carries a body: a search, a filter, a GraphQL style query. Until now the only option was POST, which claims the request changes something. QUERY now sits in the method list of every HTTP monitor, and the API accepts
httpMethod: QUERYon create and update. If a target answers with 405, that answer is the truth about the endpoint, and the monitor reports it like any other unexpected status. - Shareable results from the free tools. After a check you can create a permanent link to that exact result and send it on, which is what agencies do with a client anyway. The link is unlisted, carries a random identifier, is excluded from search engines and sitemaps, and stops working 30 days after creation. We store a result only when you ask for a link.
- A suggestion built from what was measured. Where a tool result maps to something we can genuinely watch, the page says so in the result's own terms: a certificate expiring in 23 days, a DMARC policy set to
none, an IP on a blocklist. Where it maps to nothing, the page says nothing. - Domains you look up no longer reach our analytics. Several tools carry your input in the page address so a result stays shareable as a link. That address is now cut at the question mark before it is sent to analytics. What we record about a tool use is the name of the tool, whether it returned a result or an error, and whether the input was a domain, text or a file.
- Google Tag Manager is gone from our pages. Analytics and our lead tool are now loaded directly by our own code. Nothing was added and nothing new is collected. On every page that is one fewer request to a Google host and roughly 375 kB of script that no longer has to arrive. Your consent decision still governs everything, and the default is no.
- Booking a call happens on our own page. Since 28 August the calendar is embedded at uptimeify.io/book-a-call instead of opening a second domain. Behind it runs the same self-hosted Cal.com open source edition on a machine we operate inside the EU.
What happened in the engine room
The rest of the month is infrastructure. None of it is yours to operate, and all of it you notice by nothing happening.
- Application traces on our own infrastructure. The platform and the check workers now emit traces, the timeline of a request through the application, its database queries and its queue operations, to a SigNoz instance we host ourselves. No extra provider, no subprocessor, no telemetry leaving our infrastructure. Traces carry request timing and internal operation names and are deleted after 15 days.
- Per container metrics. A worker host runs around twenty containers, so its CPU and memory numbers used to be a sum. Hosts now report memory and CPU per container, which turns a capacity decision into a measured one rather than an estimated one.
- Resolvers stay up through a deploy. Every check location runs two local DNS resolvers next to its workers. Rolling out a new worker version stopped every container at once: workers were given up to a minute to drain, resolvers were not. The result was a short, self inflicted burst of failures at the end of each deploy. Resolvers now shut down only after the workers have drained and start before them on the way back up, verified against the container runtime rather than assumed.
- Blocklist checks around four times faster. A configuration file giving each blocklist zone a direct lookup path was never actually read by our resolvers. Once it was genuinely loaded, the median blocklist job fell from around 22 seconds to under 5.
- SpamCop stays paused for now. We brought the check back and got the cause wrong, which is on the record: the free public list limits how much any one querying address may ask of it, and querying from every check location is exactly that pattern. An IP listed only on SpamCop therefore raises no new alert. The roughly forty other blocklists we check are unaffected.
New and changed subprocessors
Five entries moved in August. The full list is on the subprocessors page.
| Provider | Location | Role | Status |
|---|---|---|---|
| IONOS SE (IONOS Cloud) | Germany | server infrastructure for monitoring check nodes | new |
| netcup GmbH | Germany | also Redis job queues and databases | role clarified |
| UpCloud Ltd | Finland | also Redis job queues and databases | role clarified |
| seven communications GmbH & Co. KG | Germany | SMS and voice alerts | entry corrected |
| Zeeg GmbH | Germany | scheduling for demo and sales calls | removed |
Two notes. Nothing moved at netcup or UpCloud, the description was incomplete: alongside check nodes they run queues and databases, and the locations stay Germany and Finland. At seven.io the entry named SMS delivery only, although the provider has placed our voice calls since voice alerting existed. What it receives is the recipient's phone number and the content of the notification, for a call as for a text.
Leadfeeder has also run in its cookie free variant only since 3 August. It sets no cookies and accesses nothing on your device. Your IP address is matched against a company database and then truncated or discarded. It runs on our public website only and never inside the monitoring application.
What comes next
One limitation we would rather state than hide: a cycle we missed can still be recorded as delivered in our own availability figure if a check you triggered through the API lands in the same window. We are labelling check origin at the source to close that case. Confirmation re-checks from a second location do not have this effect, because they add no cycle.
What else is planned sits on the roadmap. We name dates there where they hold.
Every change from this month, dated and in full, is in the changelog. Why the location of a check node is more than a detail for European clients is covered in our post on EU polling nodes.
Frequently asked questions
Only if you allowlist our check nodes in a firewall. The IPv4 and IPv6 addresses for Berlin and Logroño are in uptimeify.io/ips.txt, and they were published before either node took traffic. If you keep a copy by hand, read it again. You can also filter on the X-Uptimeify-Monitor header instead, which removes IP maintenance entirely.
From the incident itself. When your target answers with 403, 406, 429 or 503, we keep the response headers that identify the sender and name the provider where the response names one. You will find it in the evidence section of the incident, as an extra block in the alert email, and as a blocking_response field in the JSON webhook payload.
Every check sends the header X-Uptimeify-Monitor with the value 1, including browser based screenshot and Playwright checks. The value is a constant and never carries a monitor, customer or account identifier. The user agent also carries SiteMonitorBot, and there you match on the substring rather than the full string.
The resolution of two detail views, nothing else. Charts, uptime figures, reports and status pages reach back exactly as far as your package allows. In the check log and the incident timeline, an older entry is one line per minute instead of one line per location, and the API returns a resolution field with the value raw or 1min.
Twelve months in full detail, including its timeline, its assignments and the alerts behind it. After that it lives on for 24 months as a daily aggregate per team and severity, carrying counts, time to acknowledge and time to resolve. Those aggregates are part of your organization data export.
On our public status page and in machine readable form at uptimeify.io/api/service-status, with no authentication. We publish trailing 90 day check delivery, the measurement coverage behind it and two figures for alert delivery. Closed months are frozen and hash chained to the one before.

Co-Founder of Uptimeify, responsible for all of marketing. He bridges technical development and marketing strategy: from Java, PHP and Shopware plugins to steering digital growth strategies. A certified UX Manager (IHK) and digital-marketing advisor to three non-profit organizations.


Google shows sources you mark as preferred more often in its answers.
More from the blog

Platform Update July 2026: 27 changes, two of them ask something of you
New probe locations, a full data export, TCP port monitoring and a second SMS carrier: every change from July in one post.

Setting Up Monitoring Alerts in Slack, Teams & via Webhook
Setup per channel: Slack, Microsoft Teams, webhook, plus the webhook payload structure (JSON) for your own pipelines. With examples.
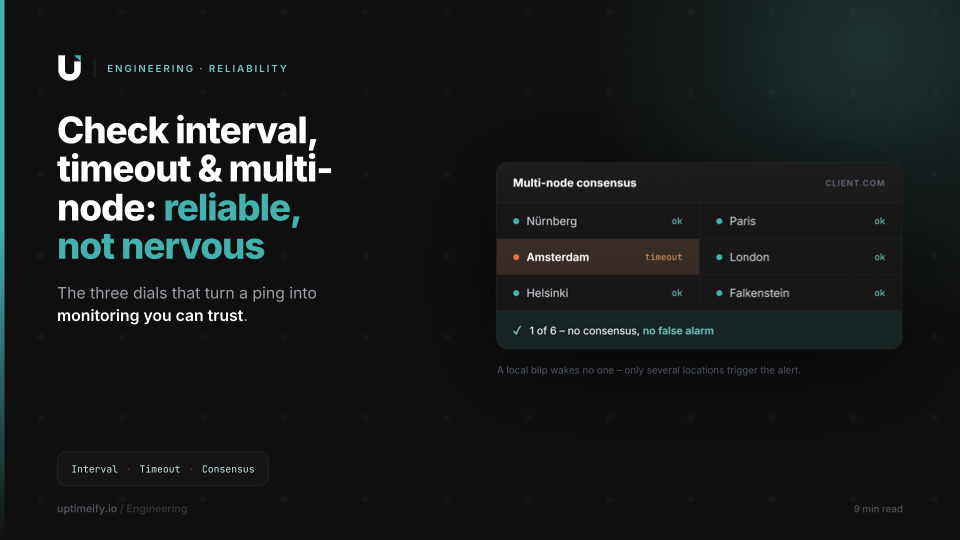
Check Interval, Timeout and Multi-Node: How Reliable Monitoring Actually Works
Check interval, timeout profiles and consensus across several EU locations: the three dials that turn a bare ping into monitoring you can trust.